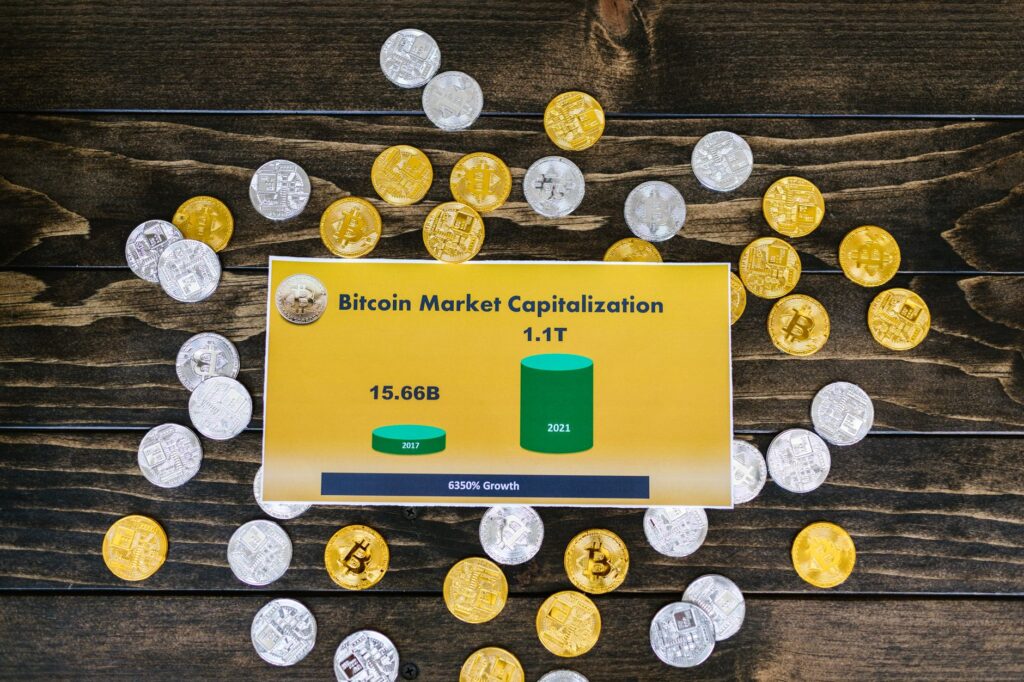
Bitcoin Ate $200M in Sells — And Didn’t Blink

The Hook
$207.56 million in realized profits hit the market in a single day — and bitcoin barely flinched.
That’s the headline most crypto traders will skim past. They shouldn’t.
When bitcoin crossed $80,000 for the first time since January, the textbook playbook was simple: holders who’d been underwater for weeks finally got their exit, they took it, and the price crumbled under the weight of all that sell-side pressure. Classic distribution. Classic top signal. Except that’s not what happened.
Instead, bitcoin absorbed every dollar of that profit-taking and held its ground. Through Sunday’s breakout. Through Monday. Into Tuesday. The price didn’t just survive the $207.56 million flush — it parked itself above $80,000 like it owned the place.
That’s not noise. That’s a market telling you something.
In crypto, as in any asset class, the real signal isn’t the price itself — it’s what happens to the price when the obvious sellers show up. Weak markets crack under profit-taking. Strong markets eat it. What bitcoin just demonstrated at a psychologically loaded, six-figure threshold is the kind of demand-side conviction that traders spend months waiting to see confirmed.
One data point doesn’t make a trend. But one data point this clean, at a level this significant, after a recovery this sharp — that earns a closer look. So let’s give it one.
What’s Behind It
The $80,000 ceiling that became a floor
Price levels carry memory. $80,000 wasn’t a random number when bitcoin punched through it on Sunday — it was a ceiling that had held firm since January, a line that marked the edge of the last significant rally before the market cooled. Every holder who bought above that level during the January run had been sitting in the red. When bitcoin finally clawed back to $80,000, those holders had one thing on their minds: getting out even.
And they did. Net realized profits — the aggregate dollar value of coins moved on-chain at a gain versus their acquisition price — spiked to a one-month high of $207.56 million on Sunday. That’s a meaningful number. It represents real people, real wallets, real exits. Not paper gains. Actual selling.
The fact that this selling coincided precisely with the breakout above $80,000 is almost poetic in its predictability. Resistance levels attract supply. Everyone in crypto knows this. The question was never whether sellers would show up at $80,000 — it was whether buyers would be there to meet them.
They were. And then some.
Bitcoin’s live price action on CoinGecko tells the rest of the story in real time: the breakout held, the level flipped, and the market moved on. That’s not a coincidence. That’s absorption.
The most bullish thing a market can do is shrug off the obvious sellers.
Why realized profits are the metric that matters here
Most people watch price. Sophisticated market participants watch flows. And right now, the flow data is saying something that the price chart alone can’t fully communicate.
Net realized profit is an on-chain metric that strips away the noise of paper gains and focuses on what’s actually happening: coins moving, gains being locked in, supply hitting the market. When this number spikes — as it did to a one-month high on Sunday — it means genuine sell-side pressure landed on the order books.
In a fragile market, a $207.56 million realized profit event would leave a mark. You’d see a wick, a rejection, a swift retreat back below the breakout level. Instead, what followed was two-plus days of price consolidation above $80,000. The sell-side flow was met by buy-side demand deep enough to swallow it whole.
But here’s what most miss: this dynamic is self-reinforcing. When sellers who were waiting at resistance finally exit, they stop being an overhang. The supply that was queued up at $80,000 has now largely cleared. The market becomes structurally lighter above that level — which makes the next leg up, if it comes, potentially faster and cleaner than the one that got us here.
The broader crypto market on TradingView reflects this recalibration in real time.
Why It Matters
What absorption at resistance actually signals
There’s a concept in market structure that doesn’t get nearly enough airtime in crypto circles: the difference between a level being broken and a level being accepted. Breaking a level is easy — any sufficiently violent spike can do it. Acceptance is harder. Acceptance means the market returns to a level repeatedly, finds buyers, and eventually stops treating it as resistance at all.
Bitcoin just took a significant step toward acceptance of $80,000.
The mechanics are straightforward. When a market absorbs $207.56 million in realized profit-taking at a key level and refuses to give back the breakout, it signals that demand at and above that level is genuine — not just speculative momentum that evaporates on first contact with real sellers. Buyers weren’t chasing price. They were stepping in to meet supply, which is a categorically different and more durable kind of buying behavior.
This matters beyond the immediate price action. Markets that absorb heavy profit-taking at breakouts tend to build stronger bases. The sellers who needed to exit have exited. The holders who remain above $80,000 are, by definition, buyers who wanted exposure at that price — not trapped investors waiting for an escape.
That’s a healthier holder base. And a healthier holder base reduces the reflexive selling that tends to hammer crypto markets on any hint of negative news or macro turbulence.
The signals pointing to structural strength
The Sunday-to-Tuesday price hold isn’t just a feel-good narrative for bitcoin bulls — it has concrete structural implications for where this market goes next.
Consider the sequence of evidence stacking up here:
- One-month profit high: Realized profits peaked at $207.56 million, confirming genuine sell-side pressure arrived at the breakout level.
- Price absorption: Bitcoin held above $80,000 from Sunday through at least Tuesday despite that heavy flow.
- January resistance cleared: The level that capped the market since January has now been retested with demand — the technical picture shifted.
- Sell-side overhang reduced: Holders who needed out at breakeven have largely exited, removing a persistent cap on further upside.
Each of these data points, in isolation, is interesting. Together, they sketch the outline of a market that has quietly done a significant amount of repair work. The recovery back to $80,000 wasn’t just a number being reached — it was a process of clearing supply, establishing demand, and setting up whatever comes next on firmer structural footing.
That doesn’t guarantee a continuation. But it meaningfully changes the risk profile of what a continuation would look like.
What to Watch
The initial signal is clean. But one week of data doesn’t confirm a trend — it opens a hypothesis. Here’s what the next chapter needs to show for the bullish case to hold up under scrutiny.
The most immediate thing to track is price behavior relative to $80,000 on any pullback. The real test of whether this level has flipped from resistance to support isn’t what happens when price is above it and grinding higher — it’s what happens when macro noise or a short-term sentiment shift pulls bitcoin back down toward it. Does it hold? Does demand re-emerge? Or does the breakdown confirm that Sunday’s move was a fake-out?
Beyond the price level itself, keep an eye on the rhythm of realized profit data. $207.56 million in a single day is a meaningful spike, but the question going forward is whether that number normalizes downward — suggesting the overhang has cleared — or re-accelerates, which would indicate fresh supply continuing to meet the market at elevated prices. The former is bullish structure. The latter is a warning.
The original CoinDesk report frames Sunday’s event as a one-month high in realized profits — watch for whether the weeks ahead show that metric cooling as the seller queue thins out.
Specific signals worth monitoring as this plays out:
- $80,000 support test: The first meaningful pullback to this level is the definitive read on whether it has genuinely flipped to support.
- Realized profit trend: Declining daily realized profits after Sunday’s spike would confirm the overhang is clearing, not growing.
- Sustained holding above breakout: Every additional day bitcoin spends above $80,000 without a sharp rejection builds the case for structural acceptance.
- Volume profile on any continuation: A move higher on shrinking volume is a red flag; a move higher on expanding volume confirms genuine demand, not thin-air drift.
The bottom line: bitcoin just passed a meaningful test. Not a final exam — just a midterm. The market absorbed the obvious sellers at the obvious level and kept its footing. That’s the kind of behavior that bulls need to see repeated, not just once, but consistently over the next several weeks, before the structural case for a sustained recovery becomes airtight.
The market has earned a watchful optimism. It hasn’t yet earned a standing ovation.
Stay Ahead of the Market
Get our daily finance briefing — sharp insights from 16 trusted sources, delivered free.