Bitcoin Eyes $79K: Highest Weekly Close Since January?

The Hook
Everyone wrote Bitcoin off this week. They were wrong.
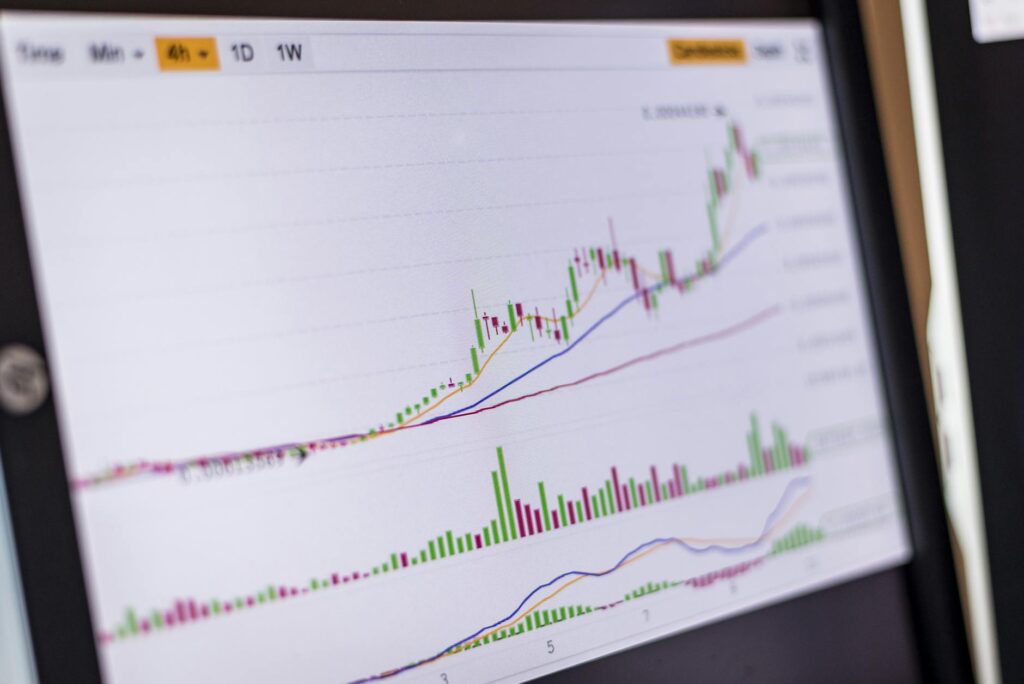
After absorbing a brutal stretch of early-week selling pressure, Bitcoin staged a quiet but unmistakable reversal — clawing back losses and pushing its price toward $79,000, setting up what could be its highest weekly candle close since the final days of January. That’s not a footnote. That’s a narrative reset.
Markets have a short memory, but weekly closes don’t lie. They strip out the noise — the intraday liquidation cascades, the social media panic, the breathless headlines about macro doom — and leave behind one clean, honest number. And right now, that number is telling a story that contradicts almost everything the bears were shouting just days ago.
The setup is deceptively simple: Bitcoin canceled out the week’s losses so completely, so efficiently, that it now stands on the edge of a technically significant milestone. A weekly close at or near $79K wouldn’t just be a price recovery. It would be a statement — one that rewrites the short-term chart structure and forces even the most skeptical traders to reconsider their positioning.
But here’s what most miss: weekly closes carry psychological and structural weight that hourly or daily moves simply can’t match. Institutional desks watch them. Quant models weight them. And when a weekly candle closes at a multi-month high, the conversation stops being about survival and starts being about momentum.
The question isn’t whether $79,000 matters. It’s whether the market is ready to believe it.
What’s Behind It
The erasure no one saw coming
Let’s be precise about what happened here. Bitcoin didn’t just drift higher — it engineered a full reversal within a single weekly candle. Earlier in the week, losses were real, tangible, and for many retail holders, demoralizing. The kind of drawdown that triggers stop-losses, prompts Twitter eulogies for the bull cycle, and sends sentiment indicators into the red.
Then the market turned. Quietly at first, then with conviction.
The mechanics of a weekly candle recovery like this are worth understanding. When Bitcoin absorbs selling pressure early in the week and then reclaims those levels by the close, it creates what traders call a “bullish engulfing” setup on higher timeframes. It signals that buyers didn’t just show up — they overwhelmed sellers decisively enough to erase every inch of damage done.
That’s not a coincidence. That’s accumulated demand waiting for a price point.
The fact that this recovery is targeting the highest weekly close since late January adds another layer of significance. January was, for many market participants, the last time Bitcoin felt like it had genuine upside momentum before macro headwinds, regulatory noise, and broader risk-off sentiment took over. A return to those levels — on a weekly close basis — suggests the market may be attempting to reclaim that lost ground in a structured, sustainable way.
A weekly close isn’t just a number — it’s the market’s final, unambiguous verdict on who won the week.
Why the January benchmark is the one to beat
Context matters here. The end of January represented a specific inflection point for Bitcoin — a moment where price action was broadly constructive, sentiment was cautiously optimistic, and the weekly chart was building what looked like a foundation for continuation.
What followed was months of compression, uncertainty, and the slow grind of a market trying to find its footing. Weekly closes became a graveyard of failed breakout attempts, each one reinforcing the narrative that Bitcoin’s best days were behind it — at least for this cycle.
So when Bitcoin’s price now approaches that January watermark again, it isn’t arriving as a beaten-down asset limping toward resistance. It’s arriving after a demonstrated ability to absorb a full week of selling and come out ahead. That’s a fundamentally different kind of approach to a key level.
The distinction matters because markets have memory. Participants who sold near January highs are now watching price return to their exit point. How they respond — whether they sell again or whether new buyers absorb that supply — will define the next chapter. A clean weekly close above the January benchmark doesn’t just break resistance. It converts it into support. And that changes everything about the intermediate-term outlook.
Why It Matters
The structural shift hiding in plain sight
Here’s the part of this story that deserves more attention than it’s getting. Weekly closes at multi-month highs don’t happen in a vacuum. They happen when the underlying supply and demand dynamics of a market have already shifted — often well before the price chart makes it obvious to the majority of participants.
Think of it as a confirmation lag. The move happens. The positioning adjusts. But most market observers only update their view when the weekly candle actually closes and the number becomes undeniable. That lag is exactly where opportunities — and risks — live.
For Bitcoin specifically, a confirmed weekly close near $79,000 — the highest since January — would represent more than a technical milestone. It would represent a shift in the weight of evidence. The market has been running on a narrative of fragility: macro uncertainty, declining volumes, bearish divergences on momentum indicators. A weekly close at multi-month highs doesn’t erase those concerns, but it subordinates them. Price is the ultimate arbiter.
It also resets the psychological reference point for a massive swath of market participants. Traders who have been anchored to lower prices — waiting for a re-test, expecting a deeper pullback — now face a choice: chase the move or watch it continue without them. That dynamic, repeated across thousands of participants, is precisely the fuel that turns a recovery into a trend.
What the bears got wrong this week
The bearish case entering this week wasn’t unreasonable. Bitcoin had shown real vulnerability, macro conditions remained unsettled, and sentiment was nowhere near the euphoric readings that typically accompany sustainable rallies. On paper, the setup for continued weakness was credible.
But credible narratives get destroyed by price action every day. And that’s exactly what happened.
The bears who pressed short positions or reduced exposure early in the week based on those fundamentally sound concerns found themselves on the wrong side of a weekly close that may end up being one of the more significant data points of the year. The lesson isn’t that macro doesn’t matter — it does. The lesson is that Bitcoin has repeatedly demonstrated an ability to front-run its own narrative, moving before the reasons become obvious.
Consider what this weekly recovery signals across the board:
- Buyer conviction: Demand was strong enough to erase an entire week’s worth of selling — a genuine show of accumulation rather than passive drift.
- Structural resilience: The ability to recover losses within a single weekly candle speaks to underlying market health that isn’t visible in daily or hourly data.
- Narrative pivot: A close near $79K forces a rewrite of the dominant bearish story — and narrative shifts move markets faster than fundamentals do.
- Historical precedent: The January weekly close level is a clean, widely-watched benchmark — breaking it confirms, not just hints at, a change in momentum.
What to Watch
The weekly close is the event. But what happens in the hours and days after it is where the real intelligence lives. A high weekly close is a signal — not a guarantee. The market’s response to that signal will tell you everything about whether this is a genuine trend shift or an elaborate head fake.
Here’s what deserves your attention as this story develops:
- The actual close number: Proximity to $79,000 matters, but the precision of the close — whether Bitcoin holds it, exceeds it, or fades below it in the final hours — will define how the technical community interprets the candle. A close at $78,200 tells a different story than one at $79,400.
- The Monday open response: How Bitcoin trades on the weekly chart in the immediate session following a major close is a reliable tell. A gap-down open that quickly recovers is bullish. A fade that accelerates suggests the weekly close was a sell-the-news event rather than a genuine breakout.
- Volume confirmation: Price moves without volume are suspect. A historically significant weekly close should be accompanied by above-average participation — more buyers, more volume, more conviction. Thin-volume recoveries are the market’s version of a borrowed suit: looks good until it doesn’t.
- January high as the new line in the sand: The level Bitcoin is testing wasn’t chosen arbitrarily — it represents the last time the weekly chart was constructively positioned. Watch how price behaves around this zone across multiple sessions. A clean hold above it redefines the range. A rejection sends the market back to the drawing board.
- Sentiment vs. price divergence: If Bitcoin closes at a multi-month high while sentiment indicators remain subdued or bearish, that’s actually a constructive setup. It means the rally hasn’t attracted the kind of retail euphoria that typically precedes reversals. Wall of worry rallies tend to be the most durable ones.
The bottom line is this: Bitcoin just ran one of the cleaner weekly recoveries of the year, and it’s doing so quietly — without the fanfare, the mainstream headlines, or the FOMO energy that typically accompanies major moves. That quiet is worth paying attention to.
The market rarely announces its most important moves in advance. It just makes them. And then, eventually, everyone looks back and realizes the weekly close at $79,000 was where the story changed.
Stay Ahead of the Market
Get our daily finance briefing — sharp insights from 16 trusted sources, delivered free.